
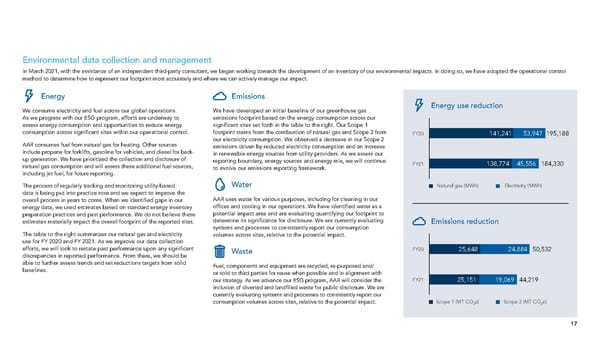
Environmental data collection and management In March 2021, with the assistance of an independent third-party consultant, we began working towards the development of an inventory of our environmental impacts. In doing so, we have adopted the operational control method to determine how to represent our footprint most accurately and where we can actively manage our impact. Energy Emissions We consume electricity and fuel across our global operations. We have developed an initial baseline of our greenhouse gas Energy use reduction As we progress with our ESG program, efforts are underway to emissions footprint based on the energy consumption across our assess energy consumption and opportunities to reduce energy significant sites set forth in the table to the right. Our Scope 1 consumption across significant sites within our operational control. footprint stems from the combustion of natural gas and Scope 2 from FY20 141,241 53,947 195,188 our electricity consumption. We observed a decrease in our Scope 2 AAR consumes fuel from natural gas for heating. Other sources emissions driven by reduced electricity consumption and an increase include propane for forklifts, gasoline for vehicles, and diesel for back- in renewable energy sources from utility providers. As we assess our up generation. We have prioritized the collection and disclosure of reporting boundary, energy sources and energy mix, we will continue natural gas consumption and will assess these additional fuel sources, to evolve our emissions reporting framework. FY21 138,774 45,556 184,330 including jet fuel, for future reporting. The process of regularly tracking and monitoring utility-based Water Natural gas (MWh) Electricity (MWh) data is being put into practice now and we expect to improve the overall process in years to come. When we identified gaps in our AAR uses water for various purposes, including for cleaning in our energy data, we used estimates based on standard energy inventory offices and cooling in our operations. We have identified water as a preparation practices and past performance. We do not believe these potential impact area and are evaluating quantifying our footprint to estimates materially impact the overall footprint of the reported sites. determine its significance for disclosure. We are currently evaluating Emissions reduction systems and processes to consistently report our consumption The table to the right summarizes our natural gas and electricity volumes across sites, relative to the potential impact. use for FY 2020 and FY 2021. As we improve our data collection efforts, we will look to restate past performance upon any significant Waste FY20 25,648 24,884 50,532 discrepancies in reported performance. From there, we should be able to further assess trends and set reductions targets from solid Fuel, components and equipment are recycled, re-purposed and/ baselines. or sold to third parties for reuse when possible and in alignment with our strategy. As we advance our ESG program, AAR will consider the FY21 25,151 19,069 44,219 inclusion of diverted and landfilled waste for public disclosure. We are currently evaluating systems and processes to consistently report our consumption volumes across sites, relative to the potential impact. Scope 1 (MT CO e) Scope 2 (MT CO e) 2 2 17
 ESG Report | AAR Page 17 Page 19